UCL climate disagreement debates
Here is my commentary on the David Archibald presentation that Alan Aylward presented. My rebuttal seminar can be downloaded here

|
Immediately I wonder - who is David Archibald? "...in oil exploration, he is operator of a number of exploration permits in the Canning Basin, Western Australia". What's his publication record? I can't find any evidence that he's ever published in the peer-reviewed literature (eg. ADS). What qualifications does he have? None relevant, as far as I can tell What was this conference that he was speaking at? It was organised specifically to promote a certain viewpoint, so it wasn't a scientific conference at all - just advocacy. According to its invite letter, "The purpose of the conference is to generate international media attention" - a PR stunt. Speakers were paid US$1000. The conference was organised by the Heartland Institute ("Free Market Solutions"). Betweem 1998 and 2006, HI received US$676,500 from Exxon, and further funding from Philip Morris, according to this. Directors of Heartland include people who also work for General Motors, Exxon, and Amoco (according to this). |

|
Why not tell the whole story? We don't just have satellite temperature measurements. Surface based temperature measurements agree very closely with the satellites, over their common period, but the record goes back 130 years instead of just 30. What has happened to temperatures over the last 130 years? North or south, it's gone up: 
|

|
A little bit of context... the northern ice cap is definitely shrinking rapidly. It has lost 25% of its area in the last 30 years. 
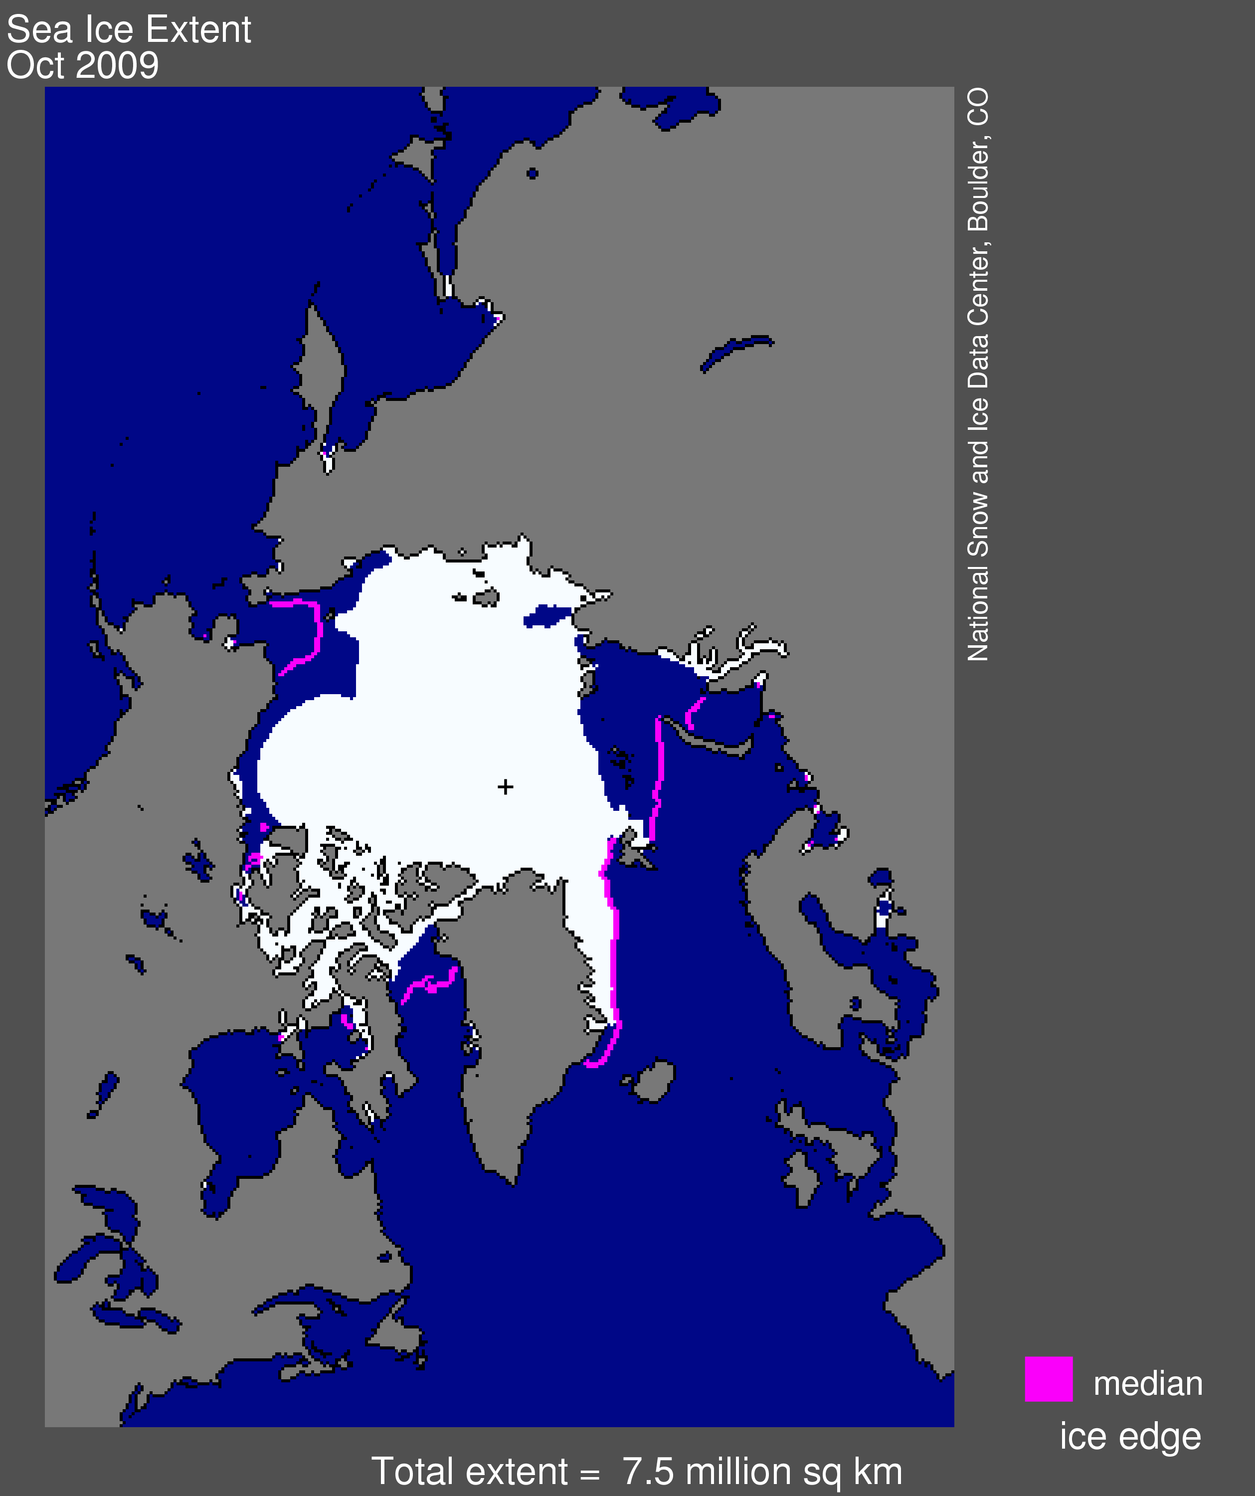
Virtually all glaciers outside the polar regions are also melting 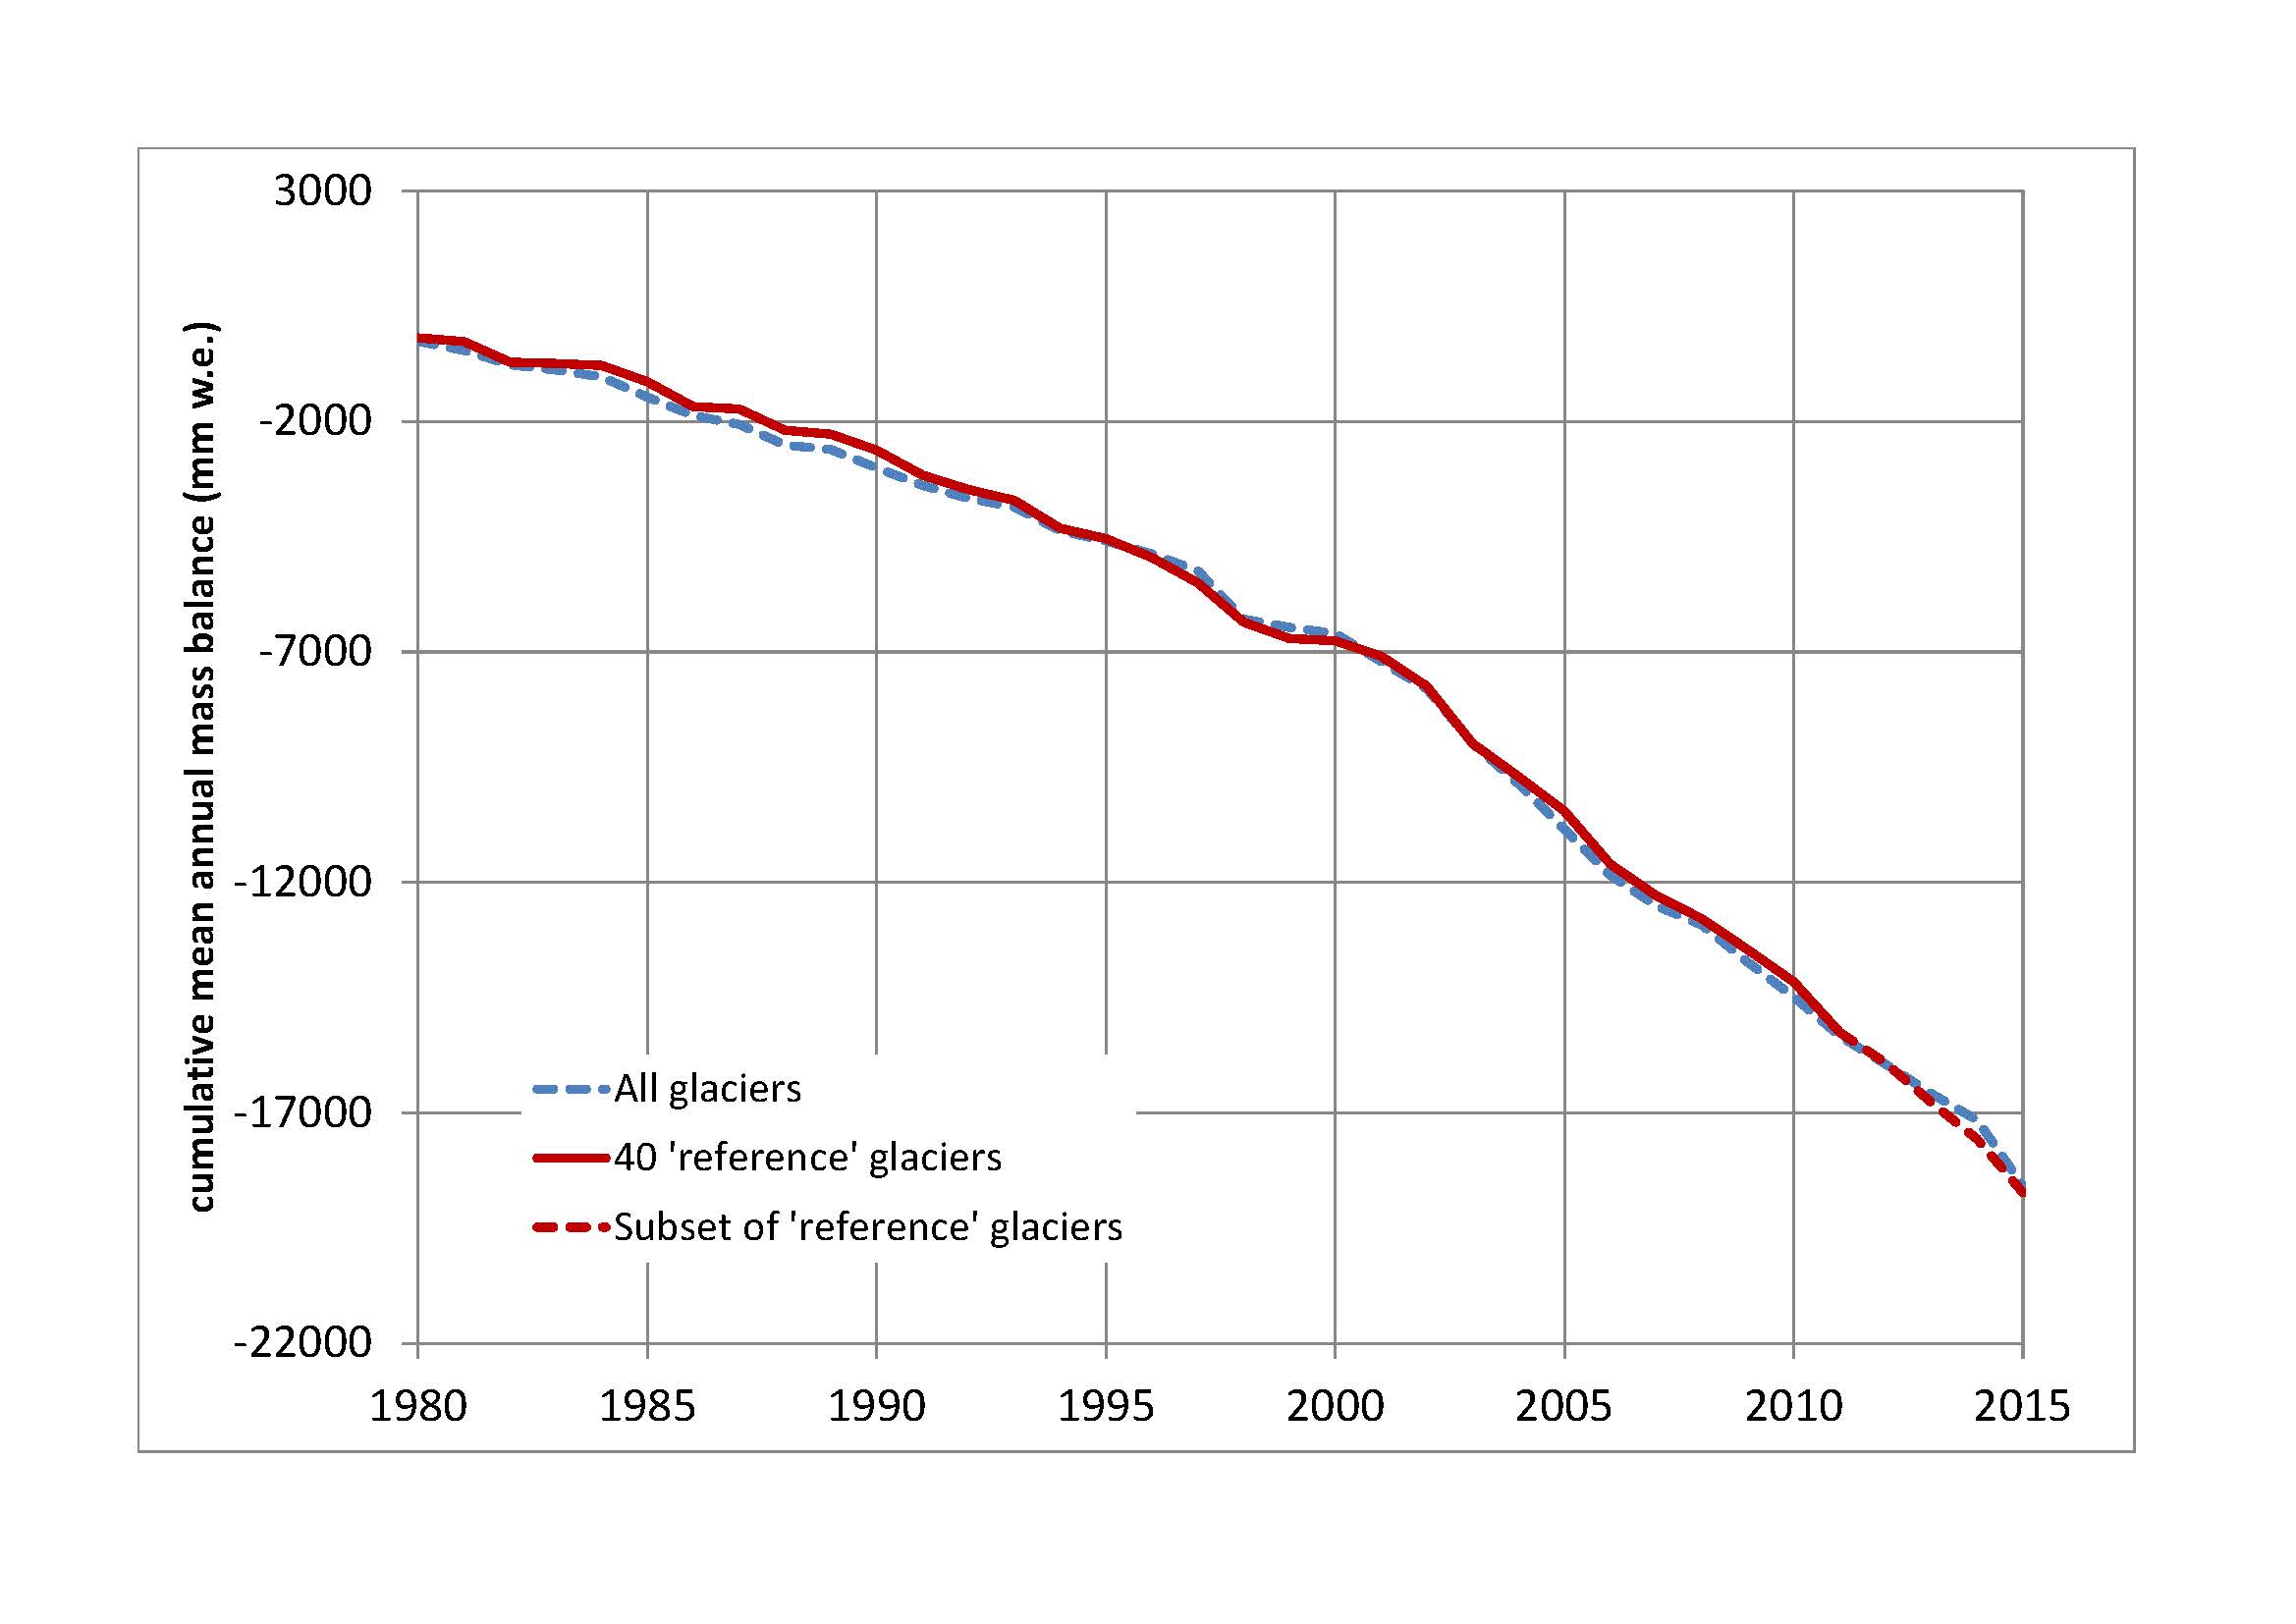
If only one of our two ice caps is melting... that doesn't particularly reassure me that everything is fine. |

|
Where are these five? Turns out they are all in one small patch of the south-eastern USA. Is that likely to be a representative sample? 
The USHCN has data from 1218 stations (see here). If you are going to chuck away 99.5% of the data, you do normally need to offer some justification for that. Better to include all the data. Here's what it looks like, for the US: 
If you're worried about contamination of the record by urban heat islands, you could always read this very comprehensive paper describing how the temperature record is derived. Also notice that if urban effects dominated, you wouldn't expect to see a drop in US temperatures from 1930-1980. |

|
The data appear to have been smoothed since the last plot, though how or why is not said. The claimed "correlation" works only if you first ditch 99.6% of the data, and then ignore the fact that over half the time span the lines are nowhere near each other. I note that there is no source for this TSI curve, nor any correlation statistics. I found a bunch of reconstructions of TSI here. I got hold of US temperatures here. I plotted US temperatures against TSI from 1880-2007. 
Does that look like a correlation to you? |

|
This graph looks like it ends in about 1995 or something. Why would it do that? Despite that you can clearly see that the most recent years are clearly the warmest in the record. A web page that looks closely at the Central England Temperature record is here |

|
OK... but there are many reconstructions of past temperatures. Whose is this, and why prefer it to all the others? Why not mention the existence of others? Like these:  |

|
This graph contradicts the previous. The mediaeval warm period appears cooler than the present day on this chart. The insinuation in both Archibald's graphs is that if it was ever warmer in the past than it is today, then humans can't be causing global warming. This is a non sequitur. |

| |

| |

|
Why no mention of volcanoes? The Dalton minimum coincided with the eruption of Tambora (the largest in recorded human history) and possibly another giant eruption. Global temperatures dropped 0.5°C after Pinatubo in 1991. Tambora was several times larger an eruption. One might attempt to estimate its effect and then work out if there was further cooling on top of that. Ignoring it entirely is simply wrong. |

|
What is he seeing that I am not? None of these temperature records look like they behave any differently during the marked period compared to outside it. Why were these three particular temperature records chosen? According to this web page, there are at least 17 European locations with temperature data available for this period. Here is a paper which compares the influence of solar variation, volcanoes and CO2 over the period in question. It finds that volcanoes were the dominant climatic influence. Also note that these three arbitrary locations do actually all show a simultaneous drop in temperature around the mid-1780s. The solar graph shows that the solar cycle that started in c. 1780 was quite strong and long. But in 1783, a volcano in Iceland erupted the largest lava flow ever witnessed by humans. |

|
If he only used the same arbitrary tiny fraction of the data each time, that would be one thing. But why now has he chosen another completely arbitrary single location? What is this supposed to be representative of? No correlation statistics are quoted. I tried to reproduce this graph. I got temperature data for De Bilt from here, and used the solar cycle length data given by Archibald later on his presentation. I got this graph: 
It looks a little bit like his, but a number of strange things are clear. Archibald's graph only has 25 points, but there were 27 solar cycles in the period he plots. His axis is clearly wrong; annual average temperatures wouldn't make sense. I averaged the temperatures during the cycle concerned to get mine. My fit doesn't look much like his, and the errors on the coefficients are huge. He plots a point at 16 years, but no solar cycle had that length, according to his own data. |

|
Another arbitrary location... why should any single place tell us anything about the global climate system? If the Sun is the primary influence on the climate, then this should obviously show up in the global average temperature record. I don't see any good reason to use individual locations, which may be affected by all sorts of local factors. Using Archibald's own list of sunspot cycle lengths, given at the end of the presentation, and global temperatures from NASA, here is a graph of solar cycle length versus global average temperature during the solar cycle, since 1880: 
Does that look like a correlation to you? |

| |

| |

|
Sure, why not? But this obviously doesn't mean that the CO2-climate relationship somehow stops existing. I'm sure no-one needs reminding that more CO2=more infrared absorption=less outgoing radiation=Earth becomes warmer. Less outgoing infrared radiation means less energy reaching the stratosphere. So if greenhouse gas concentrations are rising, the surface of the earth should warm and the stratosphere should cool. The stratosphere is cooling: 
Does the proposed 'solar-climate relationship' account for this? |

| |

| |

|
Looking at NASA's temperature data, it seems to me that the "1970's cooling period" was more like a 1970s pause in 100 years of global warming. 
I got temperature data from NASA and worked out the average temperature in each decade. The 1970s were actually warmer than 7 of the 9 decades preceding them. And each decade since then has been warmer than every decade preceding it. The idea that scientists were predicting an imminent ice age in the 1970s appears to be a myth, according to this paper. |

| |

|
Not sure on what possible basis he made this prediction. It looks to be a prediction for round about the beginning of 2009, at around 7100 counts per minute. I looked up the Oulu neutron data here. At the beginning of 2009, the recorded values were about 6750. |


|
Another set of three arbitrary locations. Where are these then? 
What makes New England so important? Why was the south eastern US important earlier but not now? |

|
Only in New England, apparently |

|
This graph doesn't look like any graph of temperature that I've ever seen. The projection appears to have no physical basis at all. |

|
Maybe true but not particularly relevant for the climate. According to the paper that I linked to earlier, lower temperatures in Europe in the 1810s were caused by volcanic aerosols, not reduced solar activity. |

|
The y-axis is wrong. The way to work out the effect of increasing CO2 is this - first you can use MODTRAN to calculate the reduction in outgoing IR radiation caused by the increase. Then you can use an estimate of the climate sensitivity to find out the temperature effect. MODTRAN tells me that if there was no CO2 in the atmosphere, the outgoing radiation would be 318.4 W/m². For 20ppm, 302.1; 40ppm, 298.6. By the time you get to current levels, each 20ppm increase decreases the outgoing radiation by about 0.2W/m². Next, you need to work out the temperature effect of this. I found an interesting web page written by David Archer, who wrote the MODTRAN interface linked above. According to him, 0.75K/W/m² is the best estimate of climate sensitivity. This means that the first bar should be about 12.2°C tall, not 1.5°C. The bars around today's value should be about 0.15°C tall. CO2 concentrations are currently increasing by about 20ppm/decade. |

|
There is no hint of how these values were calculated. Using MODTRAN and the climate sensitivity of 0.75°C/W/m², I find that the first 20ppm would cause about 12.2°C of warming, the rise to 280ppm would cause 9.7°C, the next rise to 380ppm would cause 1.05°C, and the final rise to 1000ppm would cause 3.3°C. |

|
Yep, in the past there was loads more CO2 in the atmosphere. And temperatures were far higher, and sea levels were far higher, and human civilisation didn't exist. So the relevance of that to our present situation is not clear to me. |

|
The IPCC does not do science. It only produces reports summarising the state of climate science. You'd think from this graph that everyone who ever estimated the climate sensitivity got very low values, except "the IPCC".
Who is "Idso"? Probably one of the Idsos who run the "Center for the Study of Carbon Dioxide and Global Change" - a body that has received funding from Exxon. Who is "Kininmonth"? A retired meteorologist with no published peer-reviewed research on climate change. Who is "Lindzen"? A professor of meteorology at MIT, who charges oil and gas companies US$2500 per day for consulting services. According to climate scientist Stefan Rahmstorf, "Current state-of-the-art climate models span a range of 2.6-4.1°C, most clustering around 3°C" (link) |

|
As you can see, I've tried and failed to replicate some of the graphs in the presentation. |

| |

|
No source given for these figures |

|
Exxon-funded Idso again. |

|
No source given again |

|
According to NASA, the 10 hottest years on record, from coolest to hottest, are 1997, 2008, 2001, 2004, 2006, 2003, 2002, 1998, 2007 and 2005. I can't help noticing something about those years that seems to contradict the first point #1. The second point #1 could only be true if the greenhouse effect was minuscule. We know this is not the case. The third point #1 may be true, if you believe Exxon-funded Idso. The fourth point #1 seems to have been plucked out of the air. Humans have existed as a species for maybe 500,000 years. In all of that time, CO2 concentrations never rose above 300ppm (graph) - until the beginning of the 20th century. Why would the "ideal" level be three times higher than any level human beings have ever experienced? |

|
Just in case the influence of money from fossil fuel industries wasn't already obvious enough... |